Automated Power BI Data Snapshots: Capture Historical Trends with Power Automate
Have you ever needed to analyze trends, but your data source only provides current data—with no historical records? That was exactly the challenge I faced until I built a simple yet powerful automation to capture monthly snapshots.
The Challenge
In one of my Power BI reports, I had a table that refreshed monthly but didn’t retain past data. My stakeholders needed trend analysis—tracking changes over months—but the source system didn’t store historical data.
The Solution?
A Power Automate flow that:
- Extracts data from a Power BI table
- Saves it as a CSV in SharePoint (monthly)
- Sends an email confirmation
This turned a static dataset into a historical trend-tracking goldmine!
Step-by-Step: Building the Automated Flow
Step 1: Set Up a Power BI Dataset with the Required Data
Create a table visualization in Power BI with the exact columns you want to track over time (e.g., employee name, department, and role), as this will be the data your automation captures each month.
Step 2: Create a Power Automate Flow
- Go to Power Automate → Create → Scheduled cloud flow.
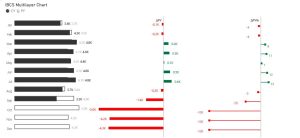
- Set the recurrence :(e.g., last day of every month at 16PM).
- Frequency: Month
- Interval: 1
- Start Time: 2025-03-31T16:00:00Z (Runs monthly on the last day at 4 PM in your time zone.)
- See below image 1
(image 1)
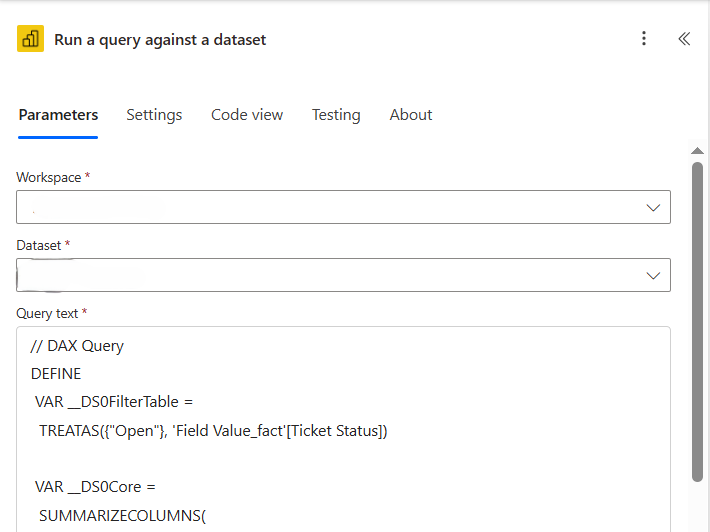
Step 3: Run a Query Against the Power BI Dataset
What It Does:
- Connects to your Power BI dataset and runs a DAX query to extract data.
(image 2)
-
- Select your Workspace and Dataset.
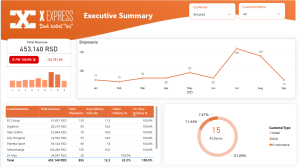
- In Query text add Table DAX query that you will get following these steps:
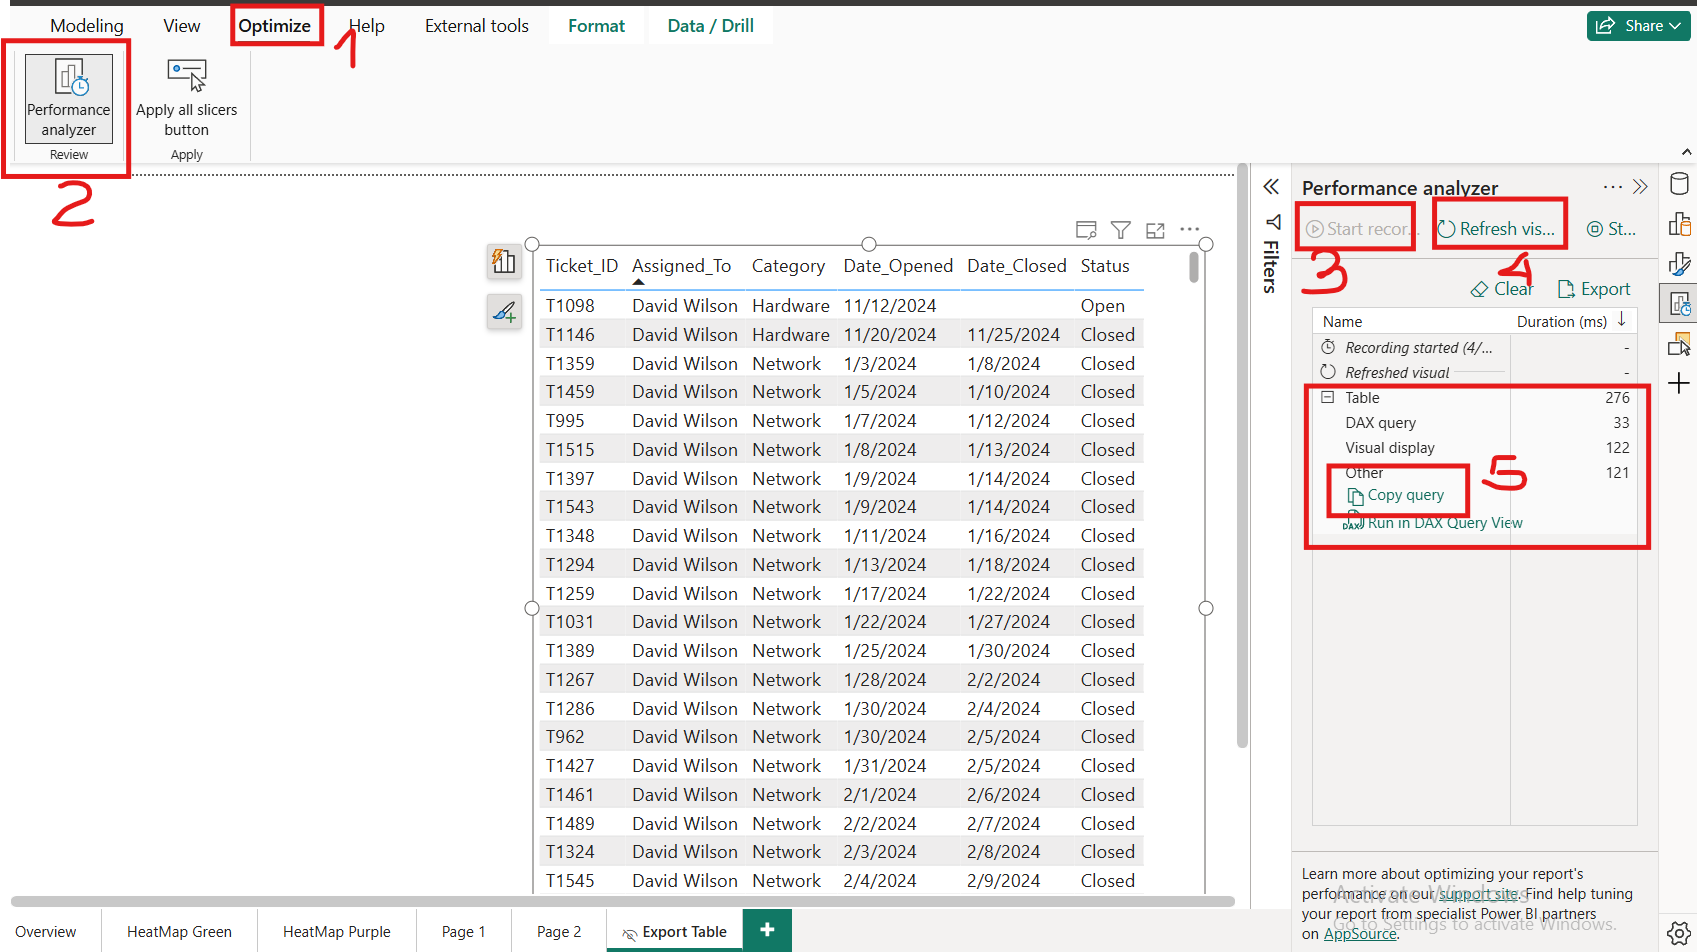
- Open the tab (in Power BI desktop) where your table is located.
- Select Optimize Tab
- Open Performance Analyzer
- In Performance Analyzer select “Start Recording”
- Select “Refresh Visuals”
- Results will show up
- Expand Table visualization
- Select Copy Query
- Steps outlined in image (3) below
(image 3)
- Go back to Automated Flow and paste the code under “Query text” (image 2)
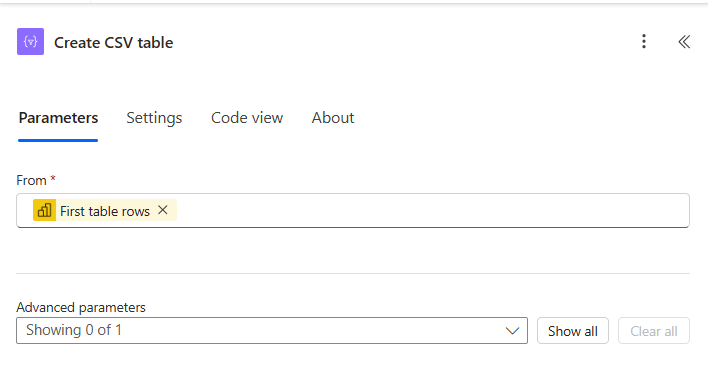
Step 4: Convert Results to CSV (Create CSV Table)
What It Does:
Converts the JSON response from Power BI into a CSV file.
In From Field select “First table rows” action (image 4 below)
(image 4)
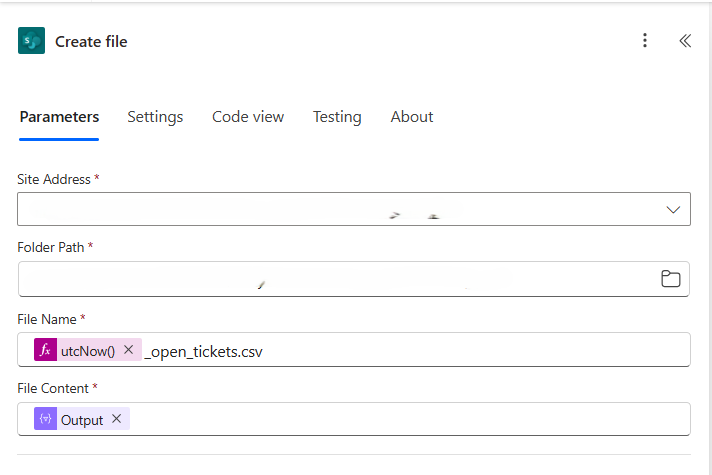
Step 5: Create File (Upload created file to Sharepoint)
What It Does:
Saves the CSV to a SharePoint folder with a timestamped filename.
- In Site Address field add URL of Sharepoint site where you want to save file (e.g., Company.sharepoint.com/sites/DataTeam)
- In Folder Path select URL of folder (Sharepoint) where files will be saved (e.g. Folder Path: /Shared Documents/HistoricalSnapshots/.
- Set dynamic file name e.g. in image below i have used utcNow() function that will add date and time when file is created and add _open_tickets title so I know which data is in the table
- In File Content select Output from previous step
(image 5)
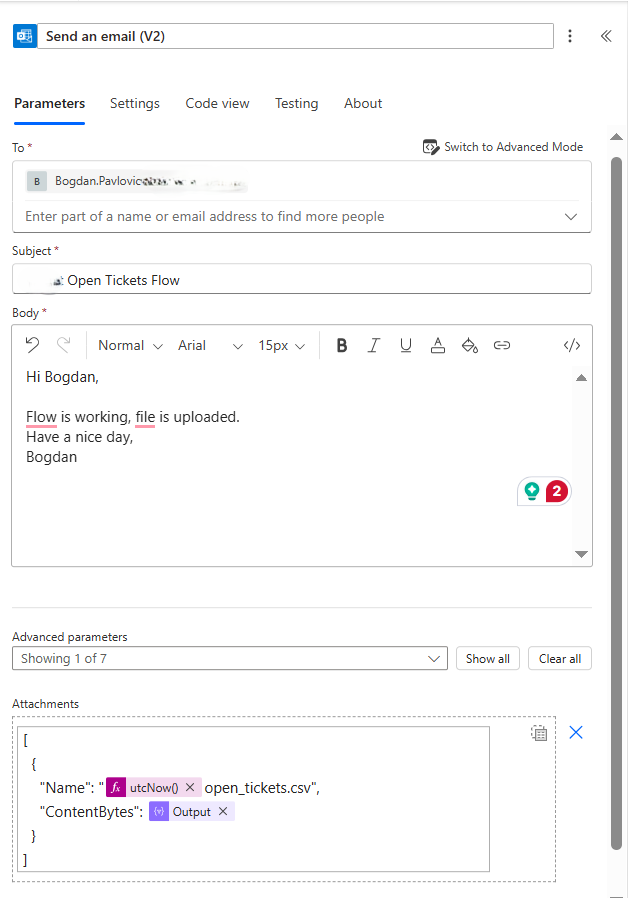
Step 6: Send an Email Notification
- Add “Send an email (V2)” (Office 365 Outlook).
- Configure:
- To: Stakeholder emails
- Subject: “New Monthly Snapshot Available: @{formatDateTime(utcNow(),’MMMM yyyy’)}”
-
- Body:
📍 Location: [SharePoint Link]Let me know if you have any questions!
-
- Attachments:
“Name:”utcNow()_open_tickets.csv – this will be attachment name it is important to add .csv extension on the end “ContentBytes”:Output
See image below:
(image 6)
Step 7: Save and Test the Flow
Where This Solution Shines
- HR Analytics – Track employee headcount, role changes, or department moves.
- Inventory/Stock Tracking – Monitor levels over time.
- Service Desk Metrics – Analyze ticket trends even if the source system overwrites old data.
Final Thoughts
This automation takes <30 minutes to set up but provides long-term historical insights without manual effort. No more losing data—just scheduled snapshots!
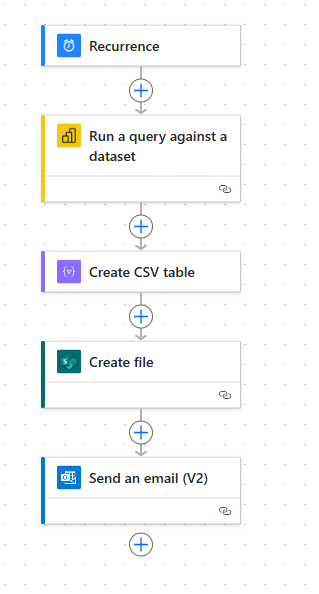
Final look of the flow with all steps:
Have you built something similar? Let me know in the comments!
- 🔗 Useful Links:
- Power Automate Documentation
- Power BI REST API Guide