Animated RAG Bar Chart in Power BI: A Dynamic Visual for Performance Insights
One of the most fundamental chart types in data visualization is the bar chart—a powerful and flexible tool that helps us explore and understand data at a glance. Whether you’re comparing metrics across categories or measuring performance against targets, bar charts remain a go-to visual for their simplicity and clarity.
But what if we could take the standard bar chart and make it more insightful, more interactive, and more visually engaging? That’s exactly what this animated RAG bar chart does.
What Is a Bar Chart?
A bar chart is… OK I know you all know what is Bar Chart
Introducing the Animated RAG Bar Chart
The RAG (Red–Amber–Green) bar chart takes this idea further. Instead of using static bars, we introduce:
-
Color gradients to represent performance zones
-
Dynamic animation to grab attention and highlight progress
-
Advanced SVG & DAX to bring custom visuals to life—without external visuals
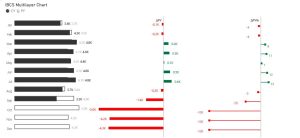
The bar starts red, transitions smoothly through amber, and ends in green—representing poor, average, and excellent performance, respectively. As the actual performance metric (e.g. Utilization ) increases, the animated bar grows and shifts colors accordingly.
For example:
Red up to 30%
Amber between 30%–80%
Green from 80%–100%
This makes it perfect for KPIs, performance reviews, or dashboard summaries where immediate color-coded understanding is key.
Target Tracking and Dynamic Color Change
One of the most powerful features of this RAG bar chart is its ability to visualize performance against a target.
Using DAX, we define a target value—this could be a static number (e.g. 90%) or dynamic based on slicer input or category benchmarks. The chart calculates the progress toward that target, and the bar fills accordingly.
When Should You Use This Visual?
Use this animated RAG bar chart when:
-
You want to compare values across categories (e.g., departments, branches, users)
-
You’re tracking performance against a goal
-
You need a visual that’s stakeholder-friendly and easy to interpret
-
You want to highlight thresholds (e.g., underperforming vs on track vs exceeding)
Whether you’re reviewing monthly targets or building dashboards for leadership, this chart provides clarity at a glance.
Why You Should Use This in Your Portfolio
Here’s why this visual stands out:
- No custom visuals required – Fully native to Power BI
- Responsive and dynamic – Works great with slicers, filters, and bookmarks
- Advanced DAX and SVG – Showcases your technical depth
- Stakeholder-friendly – Clear, color-coded, and intuitive
- Perfect for dashboards – Especially for KPI and performance tracking
- Built-in target awareness – Changes color when the goal is achieved
How to Build It
1. Create the new measure using code below:
Animated RAG Bar Chart =
VAR _Percentage = INT([SLA Compliance Rate%] * 100) //Convert SLA percentage to whole number
// SVG dimensions and positioning variables; created by Bogdan Pavlovic (powerbiwithbogdan)
VAR _TotalWidth = 1200  // total width
VAR _TotalHeight = 200 // height for larger elements
VAR _BarHeight = 80    // progress bar
VAR _VerticalPadding = (_TotalHeight - _BarHeight) /2  // Center the bar vertically
VAR _LabelWidth = 250  // label area
VAR _LabelHeight =130  // label area
VAR _LabelVerticalPadding = (_TotalHeight - _LabelHeight) / 2  // Center the label vertically
VAR _MaxBarWidth = _TotalWidth - _LabelWidth - 60 // 60 = 20px left margin + 40px right margin
VAR _ProgressBar = _Percentage * (_MaxBarWidth / 100) // Dynamic width calculation

// Determine gradient stops based on percentage with smooth transitions

VAR _ColorStops =
    "<stop offset='0%' style='stop-color:#FF0000'/>" &           // Red start
    "<stop offset='30%' style='stop-color:#FF0000'/>" &          // Hold red until 30%
    "<stop offset='40%' style='stop-color:#FF7F00'/>" &          // Blend red-orange
    "<stop offset='50%' style='stop-color:#FFA500'/>" &          // Amber middle
    "<stop offset='65%' style='stop-color:#FFD580'/>" &          // Light amber-yellowish
    "<stop offset='80%' style='stop-color:#ADFF2F'/>" &          // Yellow-green
    "<stop offset='90%' style='stop-color:#32CD32'/>" &          // Lighter green
    "<stop offset='100%' style='stop-color:#00FF00'/>"           // Full green

// Construct the SVG image with dynamic values
RETURN
    "data:image/svg+xml;utf8," &
    UNICHAR(10) &
    "<svg width='" & _TotalWidth & "' height='" & _TotalHeight & "' xmlns='http://www.w3.org/2000/svg' xmlns:xlink='https://lnkd.in/dZ5ikEfb' display='block' overflow='visible' id='svg_" & RAND() & "'>" &
    UNICHAR(10) &
    "    <defs>" &
    UNICHAR(10) &
    "        <!-- Gradient with smooth color transitions -->" &
    UNICHAR(10) &
    "        <linearGradient id='gradient' x1='0%' y1='0%' x2='100%' y2='0%' gradientUnits='userSpaceOnUse'>" &
    UNICHAR(10) &
            _ColorStops &
    UNICHAR(10) &
    "        </linearGradient>" &
    UNICHAR(10) &
    "    </defs>" &
    UNICHAR(10) &
    "    <!-- Background (light grey) rectangle for the entire SVG -->" &
    UNICHAR(10) &
    "    <rect x='0' y='0' width='" & _TotalWidth & "' height='" & _TotalHeight & "' rx='40' ry='40' style='fill: #e5e5e5'/>" & // Main rectangle
    UNICHAR(10) &
    "    <!-- Full-width grey background bar showing 100% scale -->" &
    UNICHAR(10) &
    "    <rect x='" & (_LabelWidth + 20) & "' y='" & _VerticalPadding & "' width='" & _MaxBarWidth & "' height='" & _BarHeight & "' rx='20' ry='20' style='fill: #ffffff'/>" & //remaining percentage bar you can change color by changing fill hex
    UNICHAR(10) &
    "    <!-- Rectangle for the label (percentage number) background -->" &
    UNICHAR(10) &
    "    <rect x='10' y='" & _LabelVerticalPadding & "' width='" & _LabelWidth & "' height='" & _LabelHeight & "' rx='30' ry='30' style='fill: #b0b0b0' />" & // value rectangle background
    UNICHAR(10) &
    "    <!-- Label text displaying the percentage -->" &
    UNICHAR(10) &
    "    <text x='" & (10 + _LabelWidth/2) & "' y='" & (_LabelVerticalPadding + _LabelHeight/2 + 5) & "' fill='white' text-anchor='middle' dominant-baseline='middle' font-family='Arial' font-weight='bold' font-size='120'>" & _Percentage & "<tspan font-size='80' fill='white'>%</tspan></text>" & // increase value size by chaning font-size
    UNICHAR(10) &
    "    <!-- Progress bar rectangle with animation -->" &
    UNICHAR(10) &
    "    <rect x='" & (_LabelWidth + 20) & "' y='" & _VerticalPadding & "' width='" & _ProgressBar & "' height='" & _BarHeight & "' rx='20' ry='20' style='fill: url(#gradient)'>" & //rx & ry Rounds the corners of the rectangle with a 20px radius —pill-shape
    UNICHAR(10) &
    "        <!-- Animation to gradually increase the width of the progress bar -->" &
    UNICHAR(10) &
    "        <animate attributeName='width' from='0' to='" & _ProgressBar & "' dur='2s' fill='freeze'/>" &
    UNICHAR(10) &
    "    </rect>" &
    UNICHAR(10) &
    "</svg>"
2. Set the Data Category
After creating the SVG measure:
-
Select measure
-
In top ribbon select Measure tools
-
Set Data Category to Image URL
This step is critical to render the SVG as an image in Power BI.
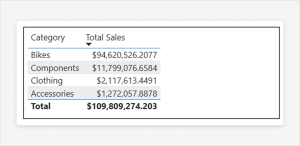
3. Use a Table or Matrix Visual
To display the animated bar chart:
-
Use either a Table or Matrix visual
-
Add the dimension (e.g., customer, region, team, name) in the first column
-
Add the measure in the next column
4. Adjust Image Size
In the visual format settings:
-
Expand the Values section
-
Set Image height and Image width to a large enough value (e.g. 28 px height , width 130px)
-
Disable word wrap for better alignment
Conclusion
The animated RAG bar chart is a creative way to go beyond static visuals and build something truly interactive and expressive in Power BI. It shows your audience exactly what they need to know—how something is performing and whether it’s on track—with zero ambiguity.
Want to build this yourself? Check out the full tutorial and copy the code directly into your report. No external visuals needed. Just pure DAX and SVG power.