Complete Guide to
Calculated Columns vs Measures in Power BI
When working with DAX in Power BI, you’ll often encounter two key components: calculated columns and measures. These are fundamental concepts for building calculations in Power BI. However, it’s essential to understand that they are not the same thing. Knowing when and how to use each one is crucial for effective reporting and analysis.
What are Calculated Columns?
A calculated column is a new column added to your table, created using a DAX formula. The formula is executed row by row, meaning that it runs for every record in the table.
Use Case: Calculated columns are useful when you need to add data to your table that is directly related to the values in each row. You can also use them for creating relationships between tables and for working with slicers or filters.
Example: Shipping Days Calculation
Imagine you have a Orders table that contains columns for Order Date and Shipping Date. You want to calculate how many days it took to ship an order.
DAX Formula:
SalesOrders
| OrderID | OrderDate | ShipDate | ShippingDays |
|---|---|---|---|
| 5001 | 01/01/2024 | 01/05/2024 | 4 |
| 5002 | 01/03/2024 | 01/06/2024 | 3 |
This formula creates a new column Shipping Days which will store the number of days between the order date and ship date for each row.
Measures
Measures in Power BI are dynamic formulas that calculate results based on the current context of a report, adapting to filters and selections made by users. Unlike static columns, measures are calculated on-demand without adding new data, keeping reports efficient and responsive. They operate at the aggregate level, making them ideal for totals, averages, and percentages that need to adjust across different views of the data. By leveraging measures, reports become more flexible, accurate, and faster, allowing data analysis without the need for multiple static calculations.
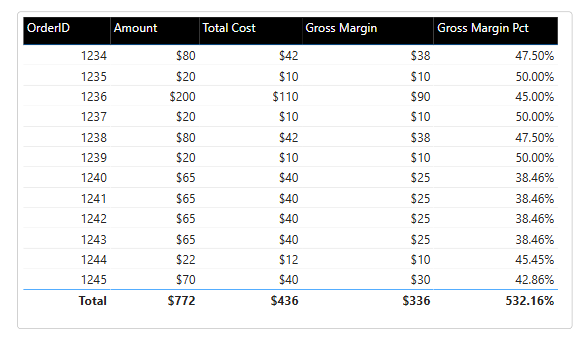
In the example below, we aim to calculate the Gross Margin % by dividing Gross Margin by Amount. We initially used a calculated column for this purpose, which provides accurate results at the individual row level. However, this approach leads to an incorrect grand total. The issue arises because the grand total simply sums up the individual percentages, rather than calculating the overall percentage based on the totals of Gross Margin and Amount. This demonstrates why using measures, instead of calculated columns, is crucial for accurate aggregate calculations in Power BI, especially when dealing with percentages or ratios.
For an accurate aggregate percentage, we need to shift our focus from individual row calculations to a holistic view of the data. The correct method involves separately summing (SUM) the Gross Margin and the Amount columns, then calculating the percentage based on these totals.
By adopting this approach, we ensure that our aggregate calculations in Power BI accurately represent the true proportion of gross margin to total sales, regardless of individual transaction sizes.
Implementing this method requires the use of measures rather than calculated columns. Measures allow for dynamic, context-aware calculations that provide accurate results at both detailed and summary levels, making them the ideal choice for percentage-based metrics.
Also changing the Gross Margin % column to an average doesn’t solve the problem. This method ignores the different amounts for each sale, leading to an incorrect overall percentage. You can see this in the table below. The total Gross Margin (336) divided by the total Amount (772) doesn’t equal the displayed 44.35%. It should actually be 43.52%. This shows why we need a better way to calculate percentages that takes into account the varying amounts of each sale.
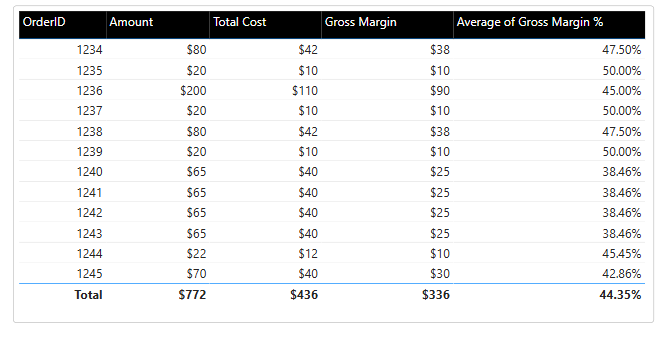
*Changing the aggregation to AVERAGE won’t provide correct results
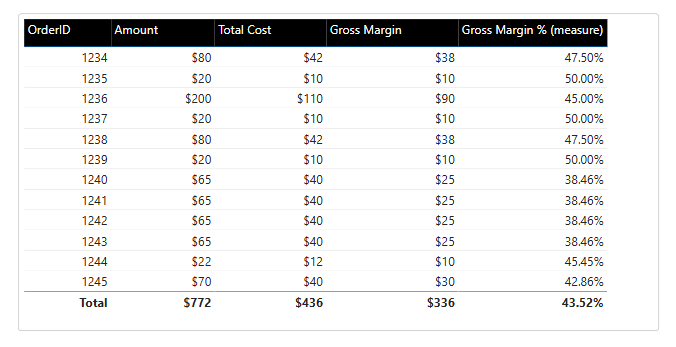
The correct calculation for Gross Margin % will be using Measure:
Gross Margin % (measure) = SUM(OrdersTable[Gross Margin]) / SUM(OrdersTable[Amount])
Gross Margin % calculated as a measure will provide correct result as you can see in table below:
Understanding Measures and Calculated Columns in Power BI
Calculated columns are created during data loading(during report refresh) and compute values for each row in a table. These values are then stored in the data model (consume memory RAM). For example, you might create a GrossMargin column like this:
Orders[GrossMargin] = Orders[Amount] - Orders[TotalProductCost]
This adds a new column to the Sales table with the gross margin for each sale. Calculated columns are useful for categorizing data, performing row-level calculations, or creating fields for slicers and filters.
Measures, on the other hand, are dynamic formulas that calculate results when a report is viewed(query time). They work with aggregated data and update based on the current context of the report. A measure for gross margin might look like this:
GrossMargin := SUM(Order[Amount]) - SUM(Order[TotalProductCost])
This calculates the total gross margin for the selected data, changing as users interact with the report.
Measures are generally more efficient because they only calculate when needed, using less memory. They’re ideal for totals, averages, percentages, and other calculations that depend on user selections.
When deciding between calculated columns and measures, consider the following:
Use calculated columns when you need:
- Fields for slicers or rows/columns in visuals
- Row-level calculations
- To categorize or group data
Use measures when you need:
- Calculations that change with user slicers
- Ratios, percentages, or comparisons
- Totals or averages for visuals like cards or KPIs
In most cases, measures are preferred for their flexibility and performance benefits. They allow for dynamic calculations that adapt to the user’s perspective on the data, making reports more interactive and insightful.
Remember, the key difference is context: calculated columns work at the row level, while measures operate on aggregated data based on the current report context. Understanding this distinction will help you create more effective and efficient Power BI reports.
Important Considerations:
-
Memory Usage: Calculated columns are stored in memory, so they can increase the size of your model. Use them when necessary.
-
Performance: If you’re using DirectQuery, calculated columns may run on the database, which can slow down your reports.
Quick Comparison: Calculated Columns vs Measures
| Feature | Calculated Columns | Measures |
|---|---|---|
| Stored in Memory? | Yes | No |
| When Calculated? | During refresh | During report use |
| Best For | Row-level calculations, relationships | Aggregations, KPIs, dynamic totals |
| Slows Model? | Yes | No |
When to Use Calculated Columns and Measures
-
Use measures whenever you need aggregations or calculations that change based on filters or slicers. Measures are ideal for KPIs, totals, averages, and ratios.
-
Use calculated columns only if necessary. They are best when you need to add a new column to your table or if you need a calculated column to create relationships between tables.
Example Scenarios:
-
Calculated Column: If you need to create a relationship between two tables or need to have a new column for each row in the table (e.g., categorizing orders into “High”, “Medium”, or “Low” based on sales).
-
Measure: If you need to calculate the total profit margin or average sales, which should be dynamic based on the filters applied by the user.
Best Practice: Using a Separate Measures Table
One of the best practices when designing your Power BI model is to store all your measures in a separate table. While this isn’t required, it helps keep your model clean, organized, and easy to maintain.
Why Use a Separate Measures Table?
-
Organization: Measures can easily get lost within tables that hold actual data. Having a separate table dedicated solely to measures helps keep your model well-organized.
-
Easier Maintenance: If all your measures are in one place, it’s easier to manage and update them when necessary. You’ll know exactly where to look if you need to adjust a measure.
-
Clarity for Other Users: If other team members are working with your Power BI model, they’ll appreciate the clarity of having a dedicated measures table.
Measures as Field Parameters
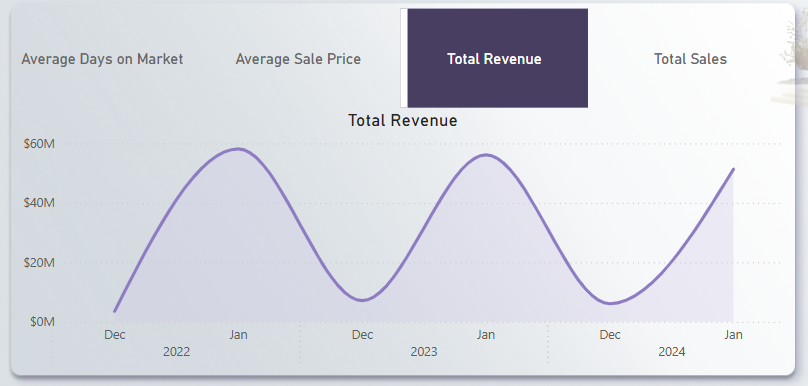
Another powerful feature in Power BI is using measures as field parameters. Field parameters allow users to dynamically select which measure to display in a visual. This is especially useful when you want to give users the ability to switch between different KPIs, like showing either Total Sales or Profit Margin on a chart.
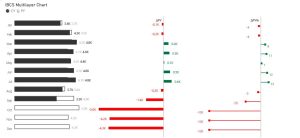
A good example of using measures effectively is in Field Parameters for Line charts. This approach allows you to display results for only the selected measure, dynamically changing the chart title to reflect the chosen metric. By using this method, you can avoid cluttering your line chart with multiple lines, which often leads to a disorganized and hard-to-read visualization.
Measures and Calculated Columns in Filter Panel
Calculated columns can be used in all sections of the filter panel. They function like any other column in your data model and can be added to:
- Filters on all pages
- Filters on this page
- Filters on this visual
This versatility makes calculated columns useful for creating custom categories or groupings that you want to use as filters throughout your report.
Measures: Measures can be used in the filter panel, but with some limitations:
- Filters on this visual: Measures can be added to this section of the filter panel. You can drag and drop a measure here to filter the visual based on the measure’s aggregated values.
- Filtering options: Once a measure is in the “Filters on this visual” section, you can set conditions such as “is greater than,” “is less than,” “is between,” and others. This allows you to show only data points where the measure meets specific criteria.
- Dynamic filtering: This feature enables creating dynamic views of your data, as the filter updates based on the current context and aggregation of the measure.
However, measures cannot be used in the “Filters on all pages” or “Filters on this page” sections.
Conclusion
Understanding when to use calculated columns and measures is essential for building efficient Power BI reports. While both are necessary, measures are usually the better choice for dynamic, context-sensitive calculations. Calculated columns, on the other hand, should be used sparingly due to their impact on model size and performance.
Keep your Power BI model clean and organized by using a dedicated measures table. It improves readability, reduces clutter, and makes it easier for others to work with your reports.
In conclusion, choose calculated columns when necessary for row-level calculations, and rely on measures for dynamic aggregation and KPI calculations.