Toy Store Sales & Operations Dashboard
Goal
A toy store chain wanted a clear, centralized way to understand how their products were performing across categories, age groups, seasons, and store locations. The management team needed to know which toys drive revenue, where inventory problems appear, and how customer buying patterns shift during the year. They wanted a fast, visual way to make better purchasing decisions, reduce overstock, and maximize profit.
Challenge
Before the dashboard, reporting was highly manual and inconsistent. Sales data existed in Excel files, inventory updates came from different systems, and managers often relied on gut feeling rather than real insight. There was no unified view that connected sales trends, stock levels, seasonal demand, and profitability. As a result:
-
Popular products often ran out too soon
-
Slow-moving toys stayed in inventory too long
-
Managers couldn’t quickly compare performance across stores
-
Decisions were reactive instead of proactive
The toy store needed a modern reporting tool that simplified all this complexity.
Solution
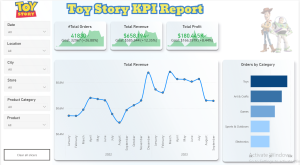
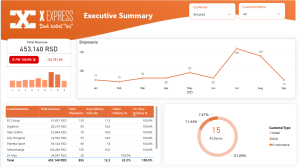
I built a Power BI dashboard that integrated sales, inventory, and seasonal performance data into one centralized report.
The dashboard includes:
-
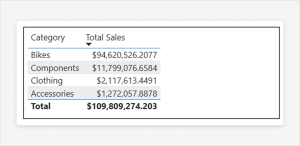
Category and product sales trends
-
Seasonal analysis to predict demand spikes (e.g., holidays, back-to-school, summer)
-
Inventory levels and stock-out alerts
-
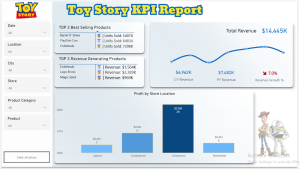
Store-to-store performance comparison
-
Profitability insights by product, category, and time period
-
Top sellers and underperforming items
Everything updates automatically, eliminating manual reporting and ensuring managers always have the latest data.
Result
The toy store gained a clear understanding of what sells, when it sells, and why. Managers now make data-driven purchasing decisions, reduce inventory waste, and react faster to demand changes.
The dashboard became a key tool for improving profit, streamlining operations, and communicating performance to store owners.
Power BI provided the fastest and simplest way to present results visually, helping the company move from guesswork to strategy.