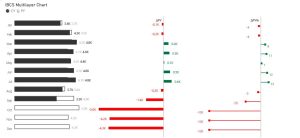
Animated Bar Chart
If you’re tired of standard visuals and want to add serious flair to your Power BI dashboards, it’s time to bring in animated bar charts using SVG and DAX.
These visuals aren’t just pretty—they’re functional, dynamic, and portfolio-worthy. Whether you’re presenting KPIs, category sales, or compliance metrics, these bars move with meaning.
What Are These Animated Bar Charts?
They’re custom visuals created using:
-
Dynamic DAX
-
Embedded SVG
-
Smooth animated transitions
-
Custom gradients, labels, and rounded corners
You control every pixel—width, color, text, timing—and best of all, it’s all done natively inside Power BI (no custom visuals or add-ons required).
Where You Should Use This
Best use cases:
-
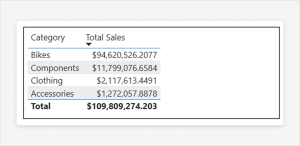
Sales per category or product
-
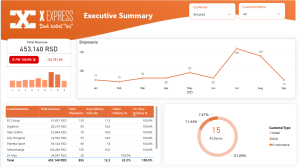
Compliance percentage dashboards
-
Performance scorecards
-
Anything with a percentage KPI
Why? Because animation draws attention to performance without requiring explanation—the visuals speak for themselves.
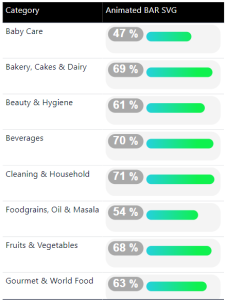
Visual Breakdown
Here’s what the animated bar chart includes:
-
Rounded Container (background)
-
Label Box with the percentage clearly shown
-
Animated Gradient Bar that grows from 0 to its value
-
SVG-Based Design that can be fully customized in Power BI
All animated with this DAX-powered SVG:
Animated BAR SVG =
    // Calculate the maximum utilization from the 'Table'
    VAR _Percentage = INT(IF([% Sales Per Category]>= 1, 1, [% Sales Per Category]) * 100)

    // Format the utilization percentage for display
    VAR _PercentageFormate = FORMAT(_Percentage, "#0")

    // Calculate the width of the progress bar based on the utilization percentage
    VAR _ProgressBar = _Percentage * 4 // Scaled width for the bar (4x larger)

    // Construct the SVG image with dynamic values
    RETURN
        "data:image/svg+xml;utf8," &
        "<svg width='480' height='120' xmlns='http://www.w3.org/2000/svg' xmlns:xlink='https://lnkd.in/dZ5ikEfb' display='block' overflow='visible'>
            <defs>
                <!-- Define a linear gradient for the progress BAR #24D1DB is blue color, 0FF14E is green-->
                <linearGradient id='gradient' x1='0%' y1='0%' x2='80%' y2='0%' gradientUnits='userSpaceOnUse'>
                    <stop offset='45%' style='stop-color: #24D1DB' />
                    <stop offset='130%' style='stop-color: #0FF14E'/>
                </linearGradient>
            </defs>

            <!-- Background (light grey) rectangle for the entire SVG -->
            <rect x='0' y='0' width='480' height='120' rx='40' ry='40' style='fill: #F4F4F4'/>

            <!-- Rectangle for the label (percentage number) background -->
            <rect x='10' y='10' width='148' height='60' rx='30' ry='30' style='fill: #A9A9A9' />

            <!-- Label text displaying the percentage -->
            <text x='84' y='40' fill='white' text-anchor='middle' dominant-baseline='middle' font-family='Arial' font-weight='bold' font-size='48'> "& INT([% Sales Per Category] * 100) &" <tspan font-size='44' fill='white'> % </tspan> </text>

            <!-- Progress bar rectangle with animation -->
            <rect x='170' y='30' width='" & _ProgressBar & "' height='40' rx='20' ry='20' style='fill: url(#gradient)'>
                <!-- Animation to gradually increase the width of the progress bar -->
                <animate attributeName='width' from='0' to='" & _ProgressBar & "' dur='4s' fill='freeze'/>
            </rect>
        </svg>"
Bonus: Static Fallback Version
Got a row that’s static or non-animated? Use this version instead:
Animated BAR SVG =
    // Calculate the percentage from the 'Table'
    VAR _Percentage = INT([Compliance%] * 100)
    // Calculate the width of the progress bar based on the percentage
    VAR _ProgressBar = _Percentage * 5.2 // Scaling factor for the bar
    // Construct the SVG image with dynamic values
    RETURN
        "data:image/svg+xml;utf8," &
        UNICHAR(10) &
        "<svg width='624' height='120' xmlns='http://www.w3.org/2000/svg' xmlns:xlink='https://lnkd.in/dZ5ikEfb' display='block' overflow='visible' id='svg_" & RAND() & "'>" &
        UNICHAR(10) &
        "    <defs>" &
        UNICHAR(10) &
        "        <!-- Define a linear gradient for the progress BAR #24D1DB is blue color, 0FF14E is green-->" &
        UNICHAR(10) &
        "        <linearGradient id='gradient' x1='0%' y1='0%' x2='100%' y2='0%' gradientUnits='userSpaceOnUse'>" &
        UNICHAR(10) &
        "            <stop offset='0%' style='stop-color: #24D1DB' />" &
        UNICHAR(10) &
        "            <stop offset='100%' style='stop-color: #0FF14E'/>" &
        UNICHAR(10) &
        "        </linearGradient>" &
        UNICHAR(10) &
        "    </defs>" &
        UNICHAR(10) &
        "    <!-- Background (light grey) rectangle for the entire SVG -->" &
        UNICHAR(10) &
        "    <rect x='0' y='0' width='624' height='120' rx='40' ry='40' style='fill: #F4F4F4'/>" &
        UNICHAR(10) &
        "    <!-- Rectangle for the label (percentage number) background -->" &
        UNICHAR(10) &
        "    <rect x='10' y='30' width='148' height='60' rx='30' ry='30' style='fill: #A9A9A9' />" &
        UNICHAR(10) &
        "    <!-- Label text displaying the percentage -->" &
        UNICHAR(10) &
        "    <text x='84' y='60' fill='white' text-anchor='middle' dominant-baseline='middle' font-family='Arial' font-weight='bold' font-size='48'>" & _Percentage & "<tspan font-size='44' fill='white'> % </tspan></text>" &
        UNICHAR(10) &
        "    <!-- Progress bar rectangle with animation -->" &
        UNICHAR(10) &
        "    <rect x='170' y='40' width='" & _ProgressBar & "' height='40' rx='20' ry='20' style='fill: url(#gradient)'>" &
        UNICHAR(10) &
        "        <!-- Animation to gradually increase the width of the progress bar -->" &
        UNICHAR(10) &
        "        <animate attributeName='width' from='0' to='" & _ProgressBar & "' dur='2s' fill='freeze'/>" &
        UNICHAR(10) &
        "    </rect>" &
        UNICHAR(10) &
        "</svg>"
Why You Should Use This in Your Portfolio
- No custom visuals required
- Responsive and dynamic
- Advanced DAX and SVG usage
- Stakeholder-friendly and visually engaging
- Perfect for performance reviews and dashboards
Watch My Full Tutorial
I’ll walk you through creating this exact animation inside Power BI from start to finish, using real metrics.