 Real Estate Dashboard – Use Case & Business Value
The Client’s Problem
The real estate team was overwhelmed with scattered reports, inconsistent data, and no reliable way to understand how their portfolio was performing. They manually tracked average prices, sales, and market trends in Excel, which made decision-making slow and often inaccurate. Leadership wanted to know:
-
Are prices growing or declining compared to last year?
-
Which locations perform best?
-
How long does it take to sell a property on average?
-
What revenue is coming in across different property types?
-
Where are opportunities or risks emerging in the market?
But without a centralized, real-time dashboard, they lacked visibility and confidence in their analytics. Decisions were based on gut feeling, not data.
What They Wanted
The client asked for a solution that would give them a complete, accurate, and real-time picture of their business — something that would help them understand the market, compare performance across locations, and guide both sales and investment decisions.
They needed a tool that was clear, fast, and easy for everyone to use: from managers to agents to leadership.
The Problems Solved
By building the Real Estate Performance Dashboard, these challenges were eliminated:
-
No more manual Excel reports
-
No more outdated market insights
-
No more guessing about sales performance
-
No more inconsistent metrics across teams
-
No more blind spots around revenue or price changes
How the Dashboard Creates Value
The dashboard provides exactly what decision-makers were missing:
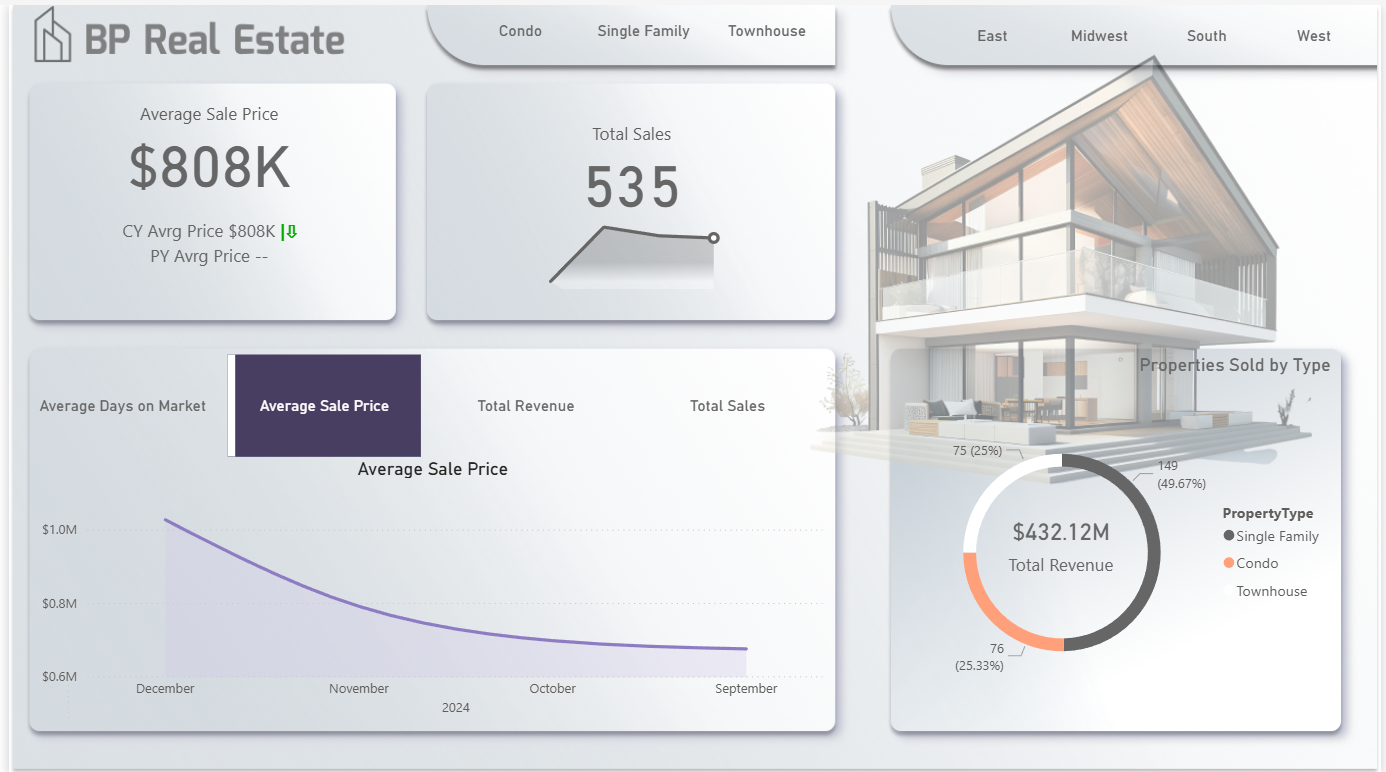
1. Market Insight at a Glance
Average prices and year-over-year comparisons instantly show whether the market is rising or declining — helping the team react quickly, not months later.
2. Clear Revenue & Sales Visibility
Total sales and total revenue metrics give leadership real-time clarity on financial performance.
3. Faster Sales Strategy
Average days on market reveal how quickly different property types sell, guiding pricing strategy and marketing efforts.
4. Smarter Targeting
Filters for property type and location allow users to focus on specific segments and discover new opportunities for growth.
5. Better, Faster Decision-Making
Teams now have one source of truth. No manual work. No disconnected reports. Just accurate insights presented visually and updated automatically.
Impact on the Organization
Since implementing the dashboard, the organization operates more efficiently and confidently:
-
Leadership makes decisions based on real-time data, not assumptions.
-
Sales teams understand which areas perform best and why.
-
Marketing focuses budgets where demand is highest.
-
Portfolio managers monitor performance trends without manual reports.
-
Everyone uses the same numbers, the same definitions, and the same source of truth.
What used to take hours of manual preparation now happens instantly — and the company finally has a scalable, reliable analytics foundation.
Here is the dashboard preview: