


Blog
-

Drill-Through in Power BI
What is Drill-Through? Drill-through is a navigation feature in Power BI that lets users click on a data point in a visual (like a bar in a chart or a row in a table) and jump to another page with more details about that specific item.…
-
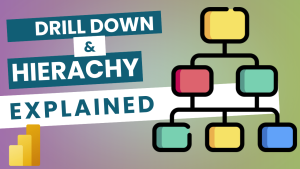
Hierarchies & Drill-Down in Power BI
Understanding Hierarchies in Depth What Are Hierarchies? Hierarchies in Power BI are structured relationships between data fields that allow users to navigate from summary levels to detailed levels of analysis. They represent natural “parent-child” relationships in your data model, enabling logical data…
-
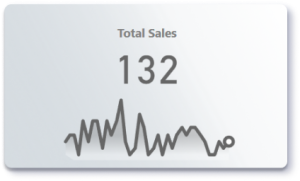
Line Chart With Gradient Shadow
KPI Line Chart with Gradient Shadow in Power BI Data visualization is key to making insights clear and actionable—and a KPI Line Chart with Gradient Shadow is a visually compelling way to track performance over time. Whether you’re monitoring sales trends, website traffic,…
-
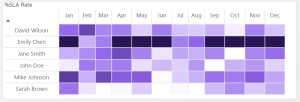
Heatmap
HeatMap Visualization in Power BI Unlock Hidden Insights with Power BI Heat Maps (Using Matrix Visuals!) Heat maps turn complex data into colorful, intuitive stories, revealing patterns and outliers at a glance. In Power BI, you can create a powerful heat map in…
-
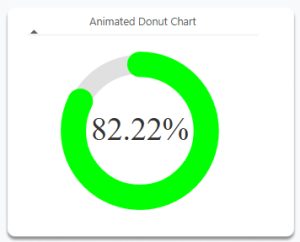
Animated Donut Chart
Animated Donut Chart The Secret Weapon for Memorable Dashboards: Animated Donut Charts Explained Animated donut charts are a visually engaging way to display progress metrics, KPIs, or completion rates in Power BI. Unlike static charts, they capture attention with smooth animations and…