Use Case: Air Quality Index (AIQ) Dashboard for Belgrade
Goal
The city’s IT & Data Office wanted a reliable and cost-effective way to monitor air quality across Belgrade, centralize hourly measurements from all stations, and prepare the foundation for a future platform where citizens can easily check air quality in their area.
Challenge
Air quality data was scattered across multiple measurement stations, each delivering readings separately. There was no unified system to collect hourly data in one place or provide a clear overview of current conditions. The solution also needed to be low-cost, automated, and easy to maintain.
Solution
I built a Power BI dashboard that automatically captures AQI readings from every measuring station via API on an hourly basis. The flow consolidates all stations into one data model and updates visualizations in real time, eliminating the need for manual data collection or file handling. The dashboard provides a city-wide snapshot of current air quality and station-level insights.
Result
City officials now have a centralized, automated, and up-to-date overview of air quality across Belgrade. The solution is cost-effective, easy to maintain, and ready to be expanded into a public-facing app for citizens. It gives decision-makers clear visibility and immediate access to actionable air quality information.
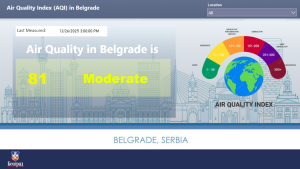
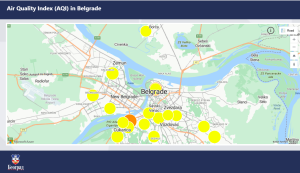
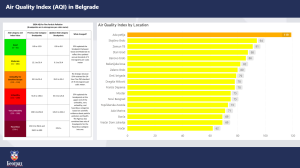
Here is the dashboard preview: