A Small Feature That Changes Daily Work
For years, working with totals in Power BI came with a quiet compromise. You could build great visuals, write solid DAX, and deliver meaningful insights, but sooner or later someone would point at the total row and say, “This doesn’t add up.”
And technically, they were wrong.
But from a business perspective, they were often right.
Power BI has always calculated totals by re-evaluating the measure in the overall filter context, not by summing the visible rows. That behavior is mathematically correct and essential for many calculations such as ratios, distinct counts, and averages. Still, it created a gap between how the tool works and how people expect numbers to behave.
With the introduction of Custom Totals (Preview), Power BI finally addresses that gap in a practical way.
What actually changed
Custom Totals allow you to override how the total row is calculated directly in the visual, without touching your DAX measure. That’s the key shift.
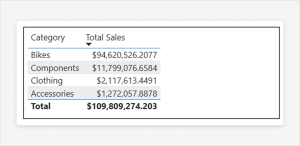
Instead of rewriting logic or creating separate measures just to “fix” totals, you can now simply choose how the total should behave. The interaction is straightforward. You right-click a column or use the Build pane and select the aggregation you want for the total. Options like Sum, Min, Max, Count, and Count (Distinct) are available.
What makes this powerful is that nothing changes in your underlying model. The measure remains exactly as it was defined. The override happens only at the visual level through visual calculations. In other words, you are not redefining the metric, you are adjusting how it is presented in that specific context.
This separation between logic and presentation is what makes the feature both simple and safe to use.
Why this matters in real scenarios
In everyday reporting, requirements are rarely static. A stakeholder might look at a report and ask for a small change that, before this feature, would require rewriting DAX. Something as simple as “can this total be the sum of what I see?” could lead to additional measures, conditional logic, and extra testing.
Now, that same request can be handled in seconds.
This has a direct impact on how reports are built and maintained. Models become cleaner because you no longer need multiple versions of the same measure just to handle totals differently. Development becomes faster because adjustments happen in the visual layer instead of the calculation layer. And communication becomes easier because you can align the report with what users intuitively expect to see.
It also changes the dynamic between technical and business roles. Previously, controlling totals was firmly in the domain of someone comfortable with DAX. Now, business analysts and report creators can make these adjustments themselves without diving into complex formulas.
A long-standing conversation finally addressed
This topic has been part of the Power BI community for years. Voices like Greg Deckler consistently highlighted the disconnect between DAX logic and user expectations. The argument was never really about correctness. It was about usability.
After nearly a decade of discussions, workarounds, and repeated questions from users, Microsoft has effectively acknowledged that need. Custom Totals feel less like a new feature and more like a response to a long-standing request from the community.
Not perfect, but a big step forward
As useful as this feature is, it does come with limitations. One stands out immediately.
Average is not available as a Custom Total option.
That is unfortunate, because average is one of the most common scenarios where users question totals in the first place. In many business cases, what people actually want is the average of category-level values, not a recalculated overall average. For now, achieving that still requires custom DAX.
So while Custom Totals significantly reduce the need for complex workarounds, they do not remove it entirely.
The balance between flexibility and correctness
One important thing to keep in mind is that Custom Totals do not replace the default behavior. The original DAX-driven total is still the most accurate representation of the measure as defined in your model.
What this feature gives you is a choice.
You can keep the mathematically correct total when it matters, or you can adjust it to better match how users interpret the data. That balance is important. In some reports, especially analytical or financial ones, strict correctness is critical. In others, clarity and usability take priority.
Custom Totals allow you to decide which one is more important in each situation.
Final thought
At first glance, Custom Totals might look like a small usability improvement. In practice, they solve one of the most common and persistent frustrations in Power BI.
They reduce the need for complex DAX, speed up development, and make reports easier to understand for end users. More importantly, they bring Power BI a bit closer to how people naturally think about totals.
After years of explaining why totals don’t add up, we can finally choose when they should.