Turn your operations into clear, actionable decisions
Introduction
This Power BI dashboard is designed for logistics companies (similar to DHL) that want a real-time, data-driven view of their entire business in one place.
From executives to operations managers, every level of the organization gets exactly what they need:
- Executives get a 30-second overview of business health and growth
- Managers gain deep insights into operational efficiency and performance
- Operational teams can identify bottlenecks and improve daily execution
The result?
Better decisions, improved service quality, optimized costs, and a clear path to growth.
The Problem
Most logistics companies struggle with:
- Data scattered across multiple systems
- No single source of truth
- Limited visibility into operations
- Delayed or reactive decision-making
- Difficulty identifying inefficiencies and revenue leaks
Without clear insights, growth becomes guesswork.
The Solution
This dashboard transforms raw logistics data into clear, structured, and actionable insights.
It is built around three key layers:
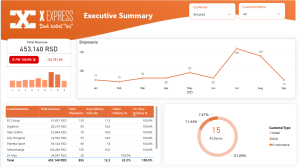
1. Executive Overview – Instant Business Health
This page answers one simple but critical question:
👉 “Are we performing well and are we growing?”
In just a few seconds, leadership can see:
- Revenue trends (daily, monthly, yearly)
- Shipment growth and seasonality
- Performance by client (revenue, volume, delivery success, timing)
Business value:
A complete, real-time snapshot of company performance that supports faster and more confident strategic decisions.
2. Operational Efficiency – Where Performance Is Won or Lost
This is the core of the dashboard.
Here, managers can clearly see:
- Shipment distribution by region, city, and delivery type
- Process timing (intake → sorting → delivery)
- Failed delivery rates and root causes
This level reveals:
- Bottlenecks in the delivery chain
- Inefficiencies in operations
- Hidden cost drivers
Business value:
Quick identification of problems and precise actions to improve efficiency and reduce costs.
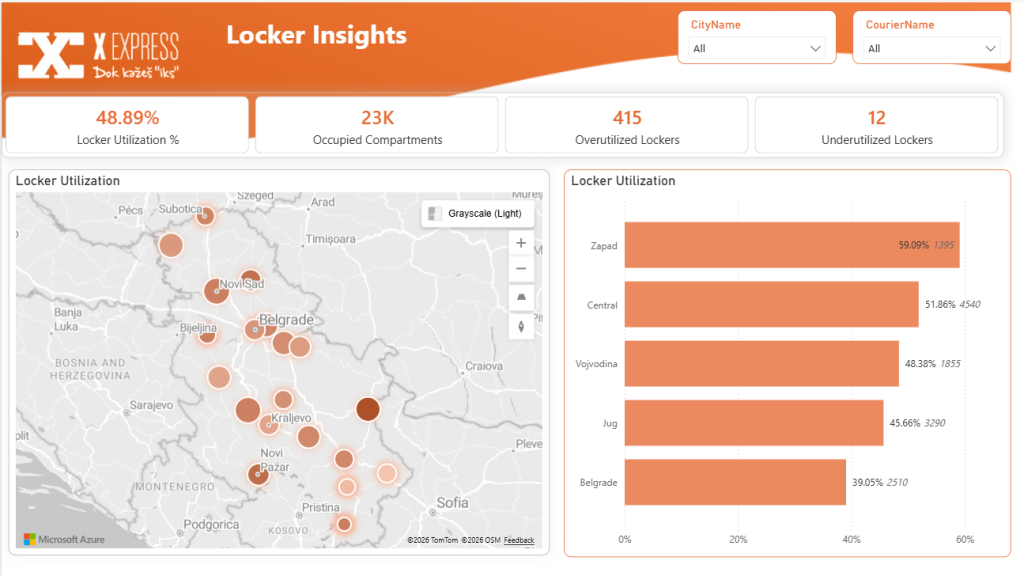
3. Locker Utilization – Unlocking Strategic Advantage
Parcel lockers are often a key competitive advantage.
This page shows:
- Utilization rate per locker
- Overloaded vs underused locations
- Capacity and demand mismatches
Business value:
Clear guidance on where to expand, optimize, or reposition lockers to maximize ROI and customer convenience.
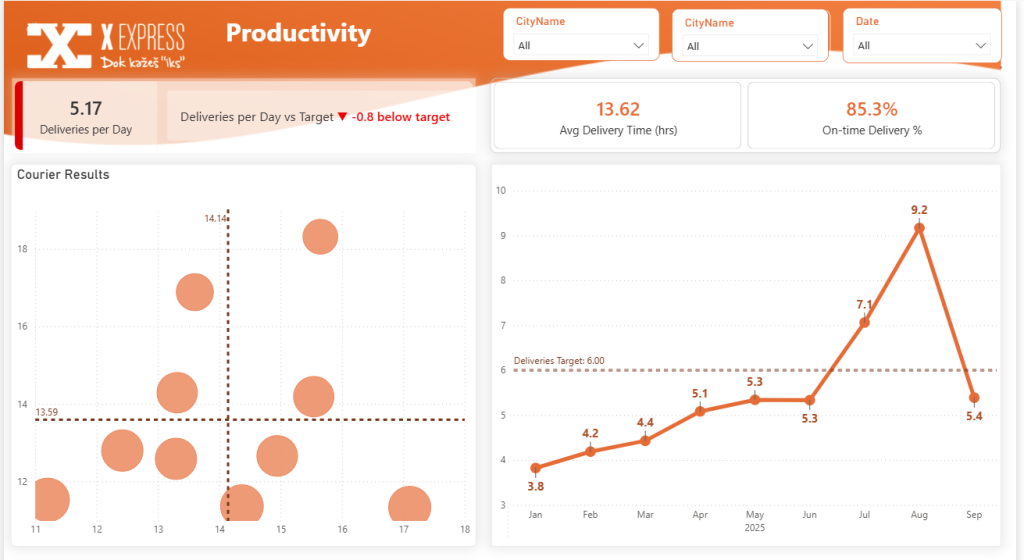
4. Courier Performance – Productivity & Accountability
Your workforce is one of your biggest cost drivers and opportunities.
This section tracks:
- Shipments per courier per day
- Average delivery time
- Delivery success rate
It enables:
- Fair workload distribution
- Identification of top and low performers
- Data-driven training and bonus systems
Business value:
Higher productivity, better service quality, and optimized resource allocation.
Built-In Guidance Page
The dashboard also includes a Guidance Page that explains:
- What each metric means
- Why it matters
- How to use it in decision-making
This ensures that anyone — from executives to operational staff — can start using the dashboard effectively in minutes.
Final Outcome
With this solution, logistics companies gain:
- A single source of truth
- Real-time visibility across the entire operation
- Faster and more confident decision-making
- Improved efficiency and service quality
- Reduced operational costs
- Clear identification of growth opportunities
Why This Matters
In logistics, small inefficiencies scale fast.
This dashboard helps you:
👉 Spot problems early
👉 Act faster
👉 Grow smarter
If you’re running a logistics operation and want full control and visibility over your business, this is exactly the kind of solution that turns data into a competitive advantage.

Here is the dashboard preview: