

If you’re the CFO of a consulting or services firm running Acumatica or another ERP, you’ve probably heard these:
- “Are we more profitable than last year?”
- “Which service line makes us money?”
- “Why did profit drop in August?”
- “How is EMEA doing?”
Can you answer them on the spot? Or do you need a day with the spreadsheet?
For most firms, it’s the spreadsheet. The P&L is exported from Acumatica, reworked in Excel and sent around at month end. It shows totals, but not what’s behind them, so every follow-up question means more manual work.
I built this Acumatica P&L dashboard in Power BI to make those answers instant.
What the P&L dashboard shows
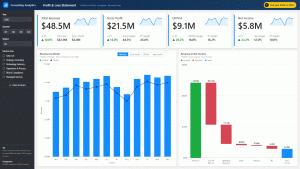
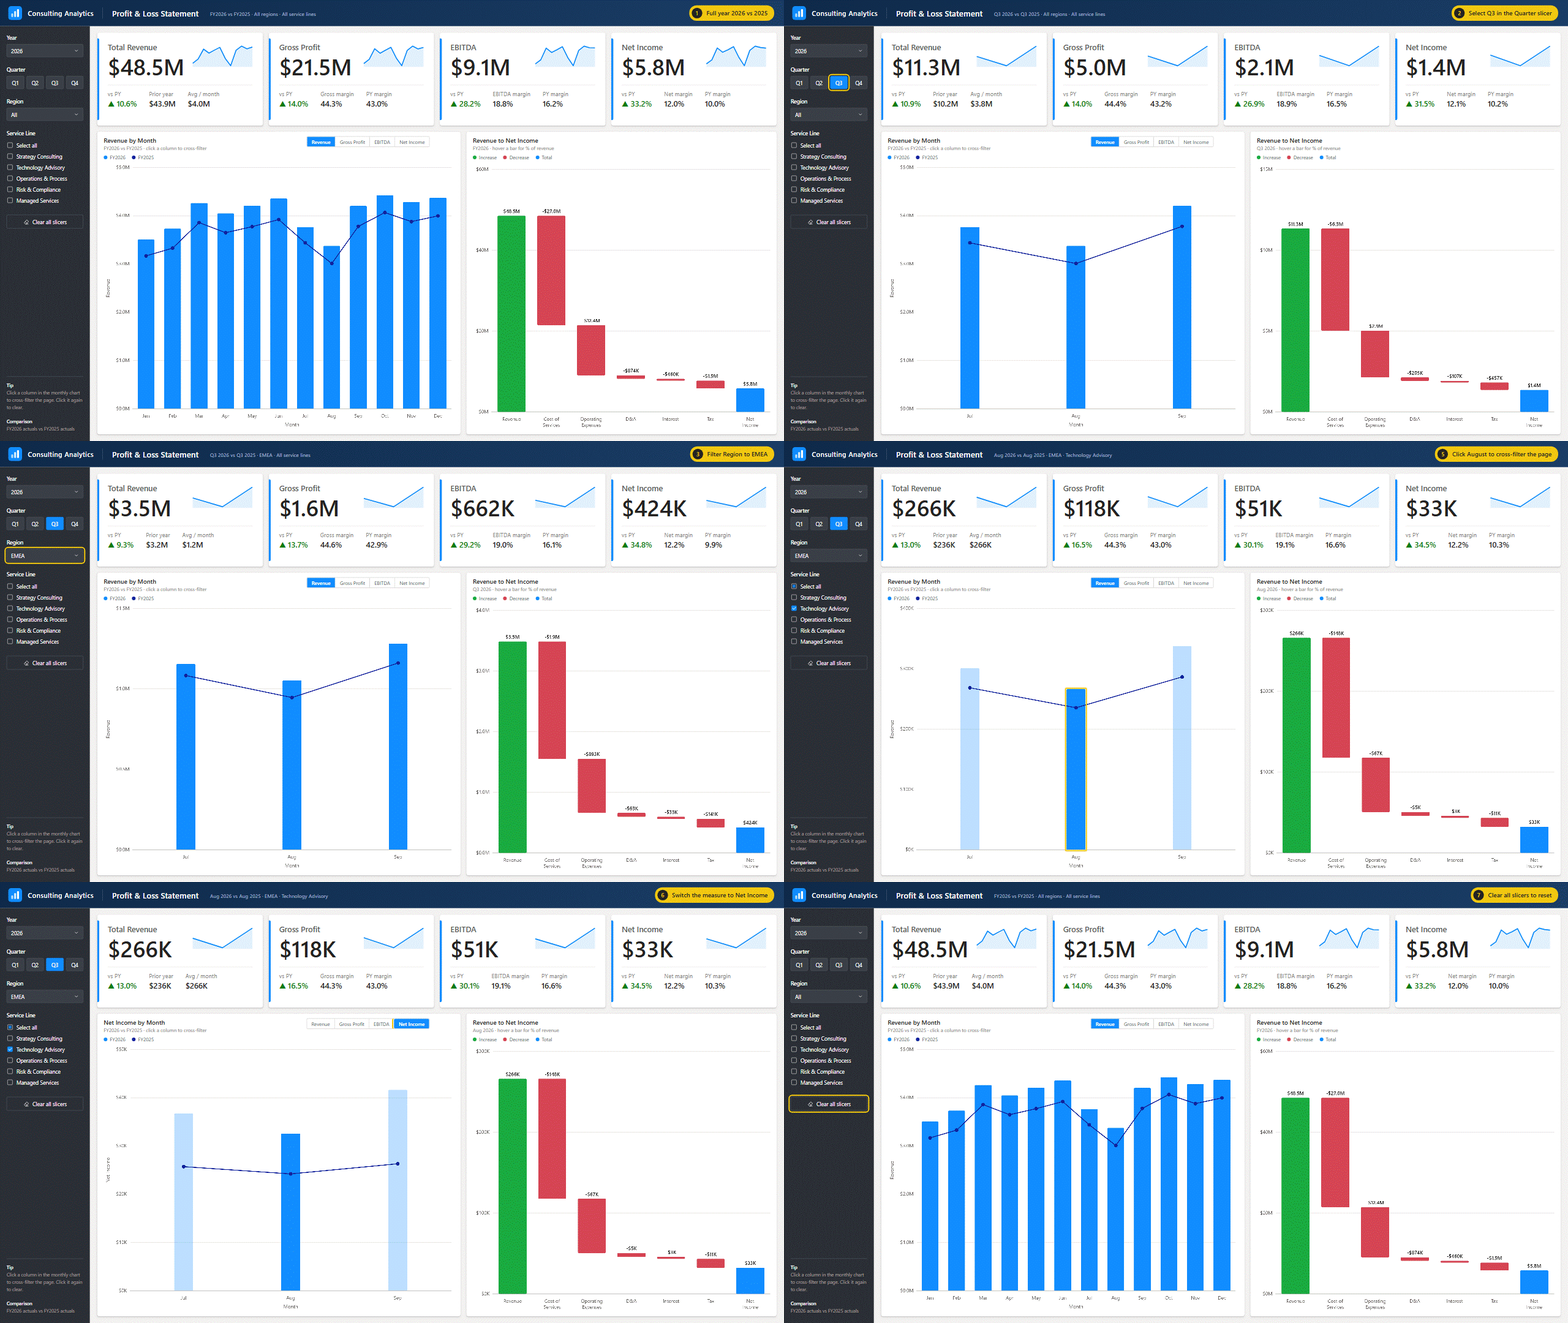
KPI cards: Revenue, Gross Profit, EBITDA and Net Income, each with the change vs last year and the margin.
Slicers: filter by quarter, region and service line. Every number updates.
Monthly trend: this year against last year. Click any month and the whole page filters to it.
Measure switch: change the trend between Revenue, Gross Profit, EBITDA and Net Income.
Profit bridge: a waterfall from revenue to net income that shows which costs reduce profit the most.
Why it matters
- Answers in seconds, not days. No rebuilding the P&L for every question.
- You see the cause, not just the result. The bridge shows whether delivery costs, overhead or tax moved profit.
- Profit by region and service line. Leaders see their own numbers, and you see the whole firm.
- Consistent year-over-year comparison for any month, quarter or year.
- One version of the numbers, so meetings focus on decisions, not on reconciling files.
Try it yourself
Pick Q3, choose a region, then click August in the monthly chart.
Open the dashboard full screen → (best on a laptop or desktop)
The demo uses sample data for a fictional firm. Built on your Acumatica data, the same report refreshes automatically.
How it connects to Acumatica
- Data: GL transactions and balances come from Acumatica through OData feeds from Generic Inquiries, the REST API, or SQL if you host Acumatica yourself.
- Your P&L structure: Acumatica accounts and account classes are mapped to your P&L lines. Branches, subaccounts and projects become slicers.
- Numbers you can trust: the report uses Acumatica financial periods and released batches only, and every line is checked against the Acumatica Trial Balance before go-live.
- Always current: scheduled refresh in the Power BI Service, with access by branch or practice if needed.
Not on Acumatica? The approach is the same for other ERPs and accounting systems. The data mapping changes, the report doesn’t.
More on this: Power BI for Acumatica.
FAQ: Power BI P&L reporting for Acumatica
Can Power BI connect directly to Acumatica?
Yes. The most common route is OData feeds from Acumatica Generic Inquiries. The REST API and direct SQL access (for private-cloud or on-premise installs) are also options. The right choice depends on data volume and how Acumatica is hosted.
Will the Power BI numbers match Acumatica?
They should, and that’s checked before go-live. Each P&L line is reconciled to the Acumatica Trial Balance by period, branch and ledger. The usual causes of mismatches are unreleased batches, the wrong ledger, or mixing financial periods with transaction dates.
Can it show branches, companies or projects?
Yes. Any Acumatica dimension, such as branch, company, subaccount segment or project, can become a slicer, just like Region and Service Line in the demo.
Does it refresh automatically?
Yes. The report refreshes on a schedule in the Power BI Service, so the P&L is current without manual exports.
Running Acumatica and want this for your firm? Let’s talk →