


Blog
-
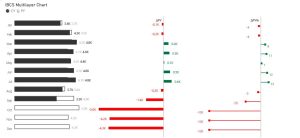
What is IBCS chart and Why is Important
In most companies, charts are everywhere. Dashboards are full of bar charts, line graphs, pie charts, and KPI cards. But despite all this visual information, one problem shows up again and again: people still misunderstand the data. This is exactly the problem…
-

How I Use Power BI to Guide Stakeholders From Data to Action
How Business Analysts Actually Use Power BI in Real Projects Most people look at Power BI and immediately think of dashboards. A set of charts, some filters, maybe a few KPIs at the top. Something that summarizes what is happening in the…
-
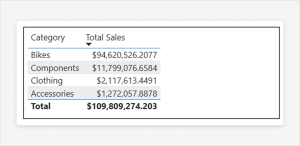
Custom Totals in Power BI: Finally Giving Control Back to Report Developers
A Small Feature That Changes Daily Work For years, working with totals in Power BI came with a quiet compromise. You could build great visuals, write solid DAX, and deliver meaningful insights, but sooner or later someone would point at the…
-

This simple trick will make your Power BI refresh 7x faster
This Simple Power BI Trick Can Make Your Refresh Up to 7x Faster Bogdan Pavlovic5 min read Introduction If your Power BI report takes forever to refresh, or worse, randomly fails without a clear reason, you’re not alone. I’ve seen this happen…
-

How I Fully Automated a Daily Excel/ZIP files Report Using Power BI and Power Automate
Automating recurring Excel reports is one of the most common requests we get as Power BI developers. On paper, it sounds simple: every day an email arrives with a report, you copy–paste the content into an Excel file that already contains formulas,…